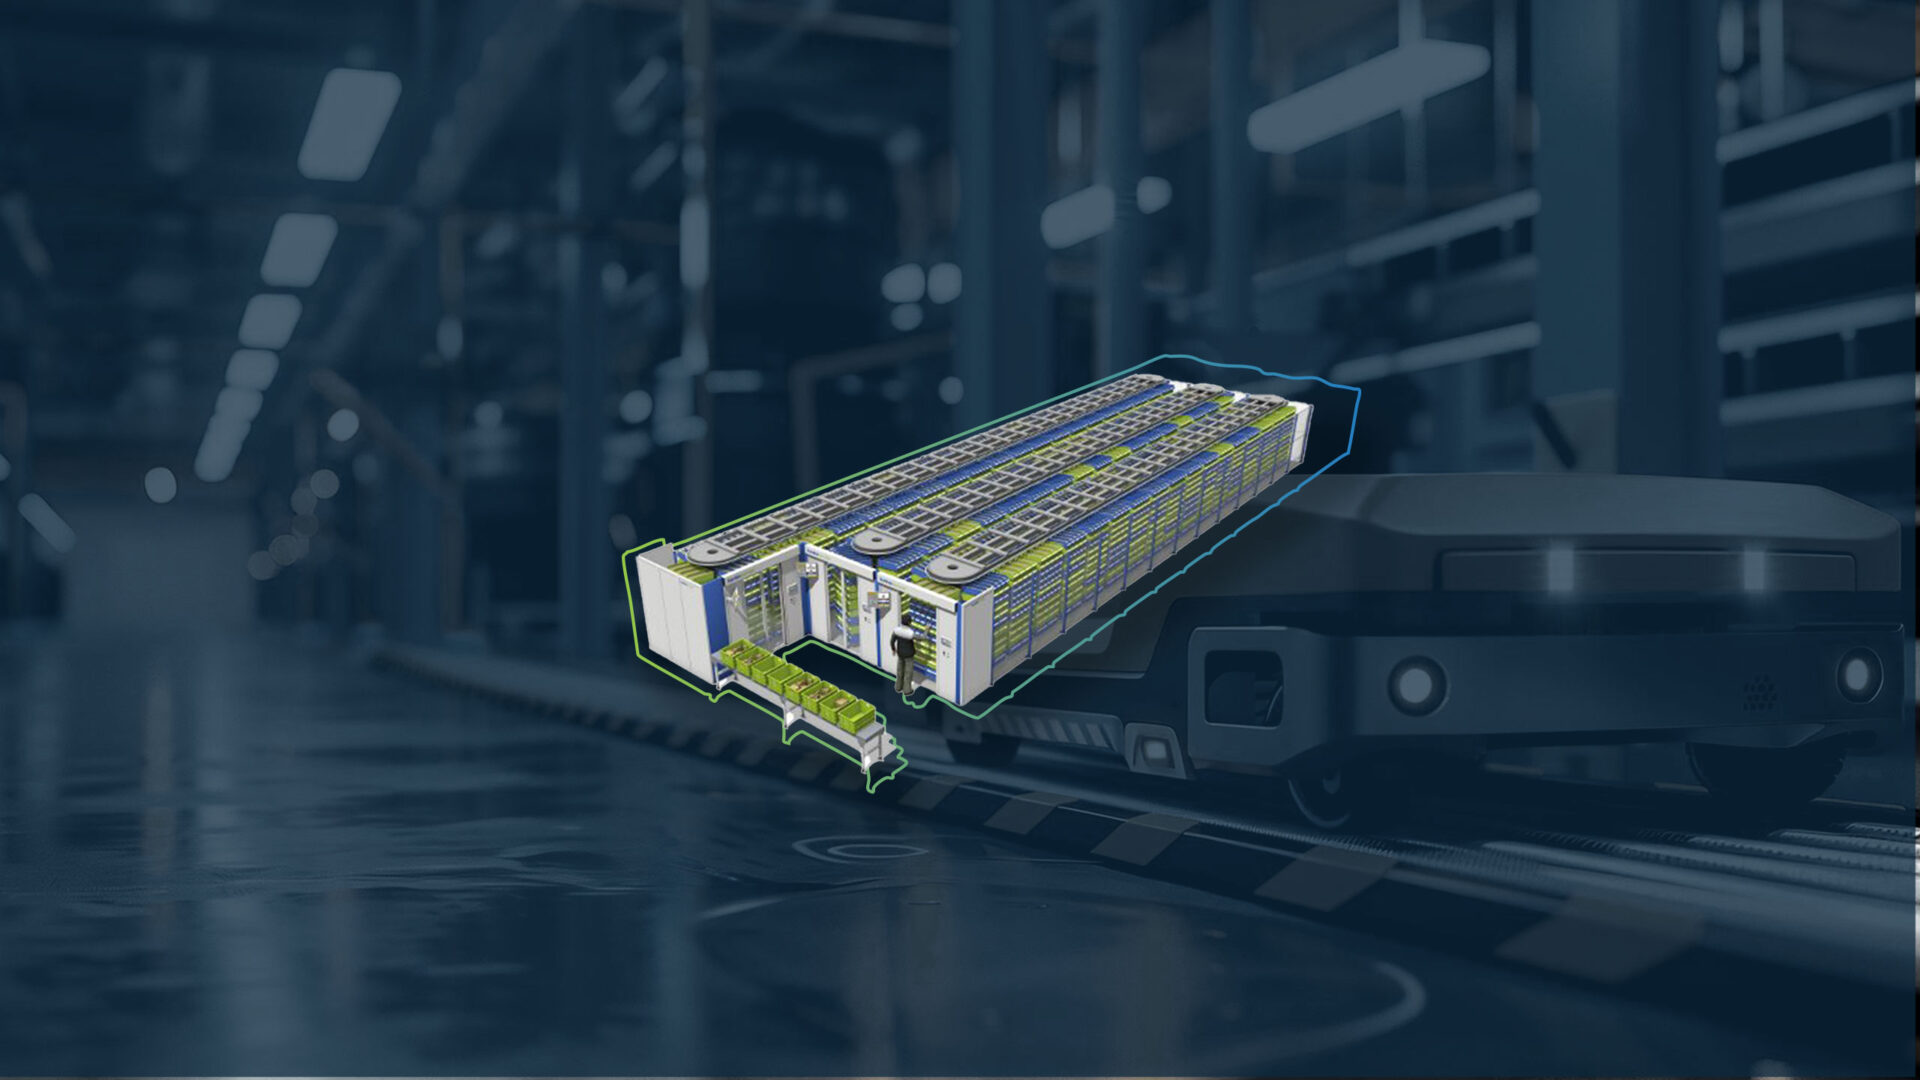
Automated storage systems: circulation system
Recirculating systems are compact, automated storage systems for fast access, high efficiency and optimum use…

Blog
You don’t know how good or bad you are in a particular area of the company? Do you regularly discuss whether option 1, 2 or 3 is better, but it’s always just a gut feeling? Then it’s time to record KPIs and establish a KPI management system! In this article, we want to show you how to create a meaningful KPI system based on your corporate strategy and objectives and how to build on this to create a KPI management system.
Use key figures to see where there is potential for optimization!
Dominik Fackler, Senior Consultant
Process KPIs make it possible to understand and evaluate processes in production and logistics. With the help of this evaluation, better decisions can be made. In addition, you can see from the process KPIs where there is potential for optimization. Regardless of whether you currently have too much or too little data as a basis for your KPIs, I will show you in four steps how to establish KPI management in your company.
You can use these steps to establish a key figure management system:
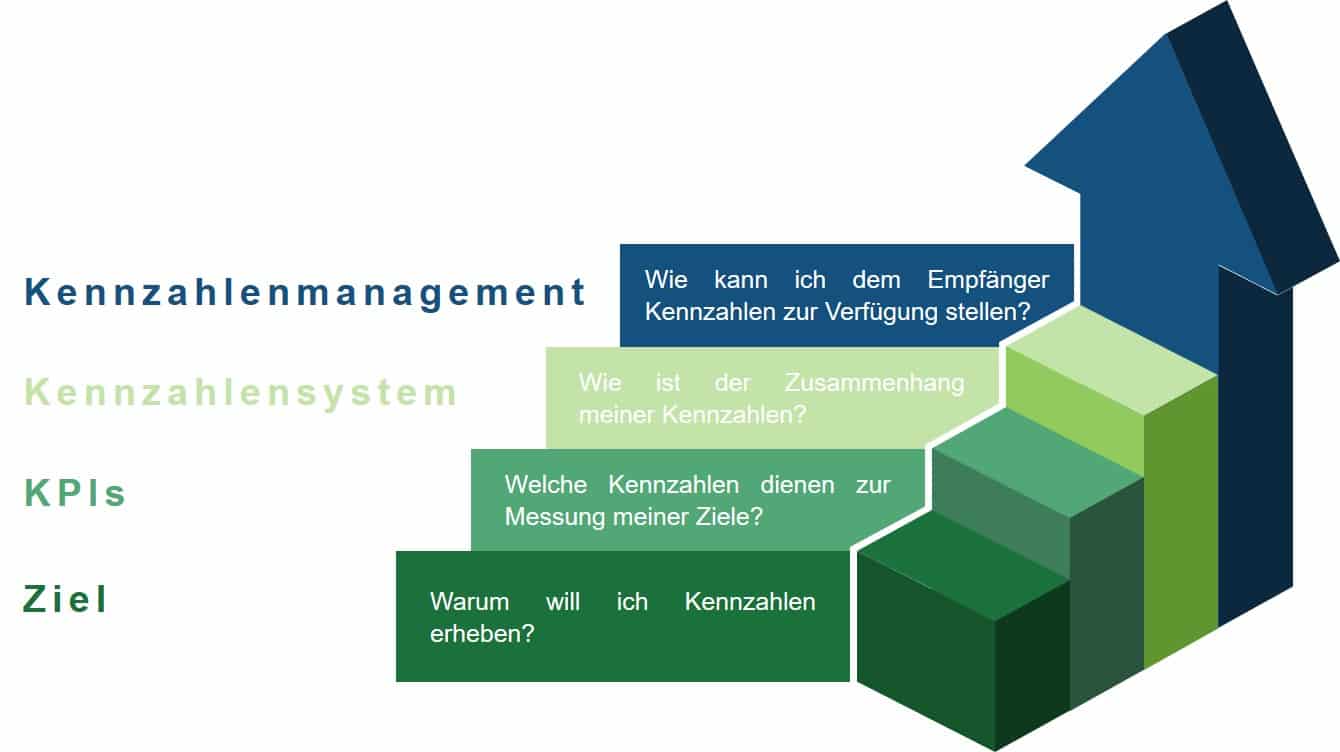
Why do you want to have a KPI system in your company? There can be various reasons for establishing a KPI system and KPI management: Process KPIs can be used as an overarching information or analysis tool or as a control element.
The use of key figures as an analysis tool is suitable for monitoring processes. For example, you can use the key figure “rejects per hour” to see whether your system is running with the correct settings. On the other hand, you can use your KPI system as an early warning indicator, e.g. for predictive maintenance. If previously defined tolerance thresholds are exceeded, countermeasures can be taken. The third major area of use of KPIs as an analysis and information tool is the evaluation of decision alternatives. The right key figures help management to make better decisions. One example of this is the ROI (return on investment) of a machine purchase.
First of all, think about what purpose your KPI system should serve.
Dominik Fackler, Senior Consultant
In addition to their function as an information and analysis tool, key figures can be used for control and management purposes. The control function is important, for example, in a large company with different divisions or in a holding company with several companies. Here, individual targets for the different units can be derived from an overall target for the company, thus ensuring that everyone is working towards the same goal. Process KPIs can also be used as a management tool. Goals for individual persons or organizational units can be derived from the company goals. Key performance indicators can then be used to track how these targets are being met.
Different process KPIs are required depending on the objective you are pursuing with your KPIs. As a first step, you should therefore think carefully about the purpose for which you want to use KPIs and, associated with this, who the recipient of the KPIs is. If you do not do this, you run the risk of the KPIs not being meaningful and therefore useless. In the end, the different purposes of the KPIs may well result in different KPI systems.

Senior Consultant
I hope that this article has aroused your interest in establishing a KPI management system. Do you have any questions or comments about the article? Then please do not hesitate to contact me at any time.
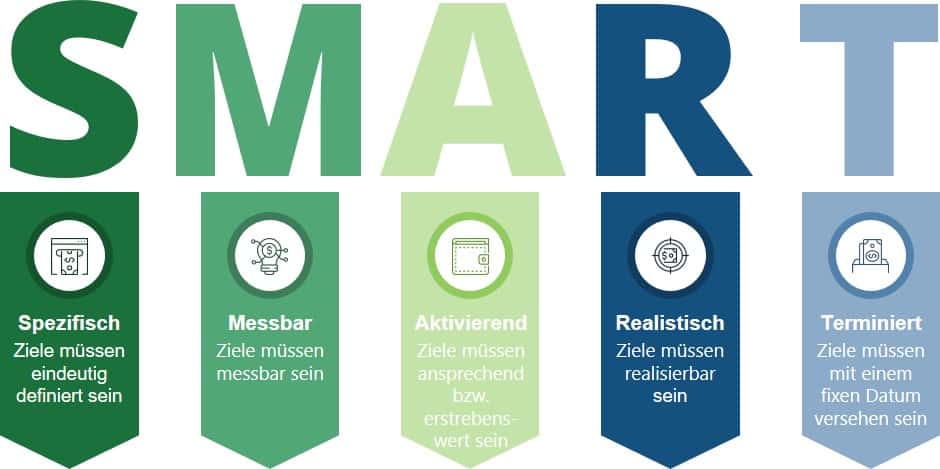
In the first step, you considered the purpose of your KPI system. The next step is to find the appropriate process KPIs for this. The starting point of a KPI system is always the corporate strategy. Goals can be defined from the strategy, for which suitable KPIs can then be generated. If you do not have clear objectives at company or divisional level, you should think about these first. All goals that you define should comply with the SMART rule (Specific-Measurable-Activating-Realistic-Timed). Make a note of all objectives and derive key figures from them in the next step.
For example, if the company’s goal is to be the quality leader in a product range, one possible KPI could be the number of customer returns. If, on the other hand, your goal is cost leadership in logistics, possible KPIs could be the cost per pick in the warehouse or the storage fee. These examples show how important the clear definition of targets is for the implementation of KPI management. If you collect KPIs without clear targets, they will have no control, management or analysis function and you will not generate any added value from KPI management.
To ensure that your process KPIs are balanced, they should come from different areas (e.g. quality, service, productivity, time, efficiency, structure, etc.). For example, it makes no sense to only collect financial KPIs, as otherwise you would only focus on these and other areas, such as quality, could suffer as a result. It is also important to collect different types of key figures. For certain applications it may make sense to use absolute key figures (e.g. number of employees), for others relative key figures (number of picks per picker) make more sense.
The situation is similar with local or global, strategic or operational key figures. The most important thing here is differentiation and a mix in order to achieve a balanced KPI system. You should start with KPIs that answer questions that regularly concern you and for which you have only ever been able to answer according to your gut feeling. Do you think your stock levels are too high? Then measure the inventory turnover rate, for example. You can now find definitions and lists of key figures and benchmarks on countless websites or in special databases.
Less is more – concentrate on the key figures!
Dominik Fackler, Senior Consultant
Another important point is the number of key figures. The good data basis thanks to digitalization makes it possible today to collect countless key figures, which is something that is often done. Key figures look good on specially visualized dashboards and therefore the maxim “more is better” often applies. However, you should not be tempted by the possibilities, but should think carefully about which key figures make sense for you. A good guideline is 15-20 key figures per business unit (e.g. logistics, production), which you collect and discuss regularly. In practice, 3-5 focus KPIs that you should concentrate on and report to management have proven successful.
To enable you to establish a balanced KPI management system that is aligned with the company’s objectives, as described in the previous paragraph, it is advisable to use standard logic for KPI systems. In the following, we would like to introduce you to two different key figure systems that are widely used: The value driver tree and the balanced score card.
You don’t have to reinvent the wheel – use existing logic to set up a KPI system!
Dominik Fackler, Senior Consultant
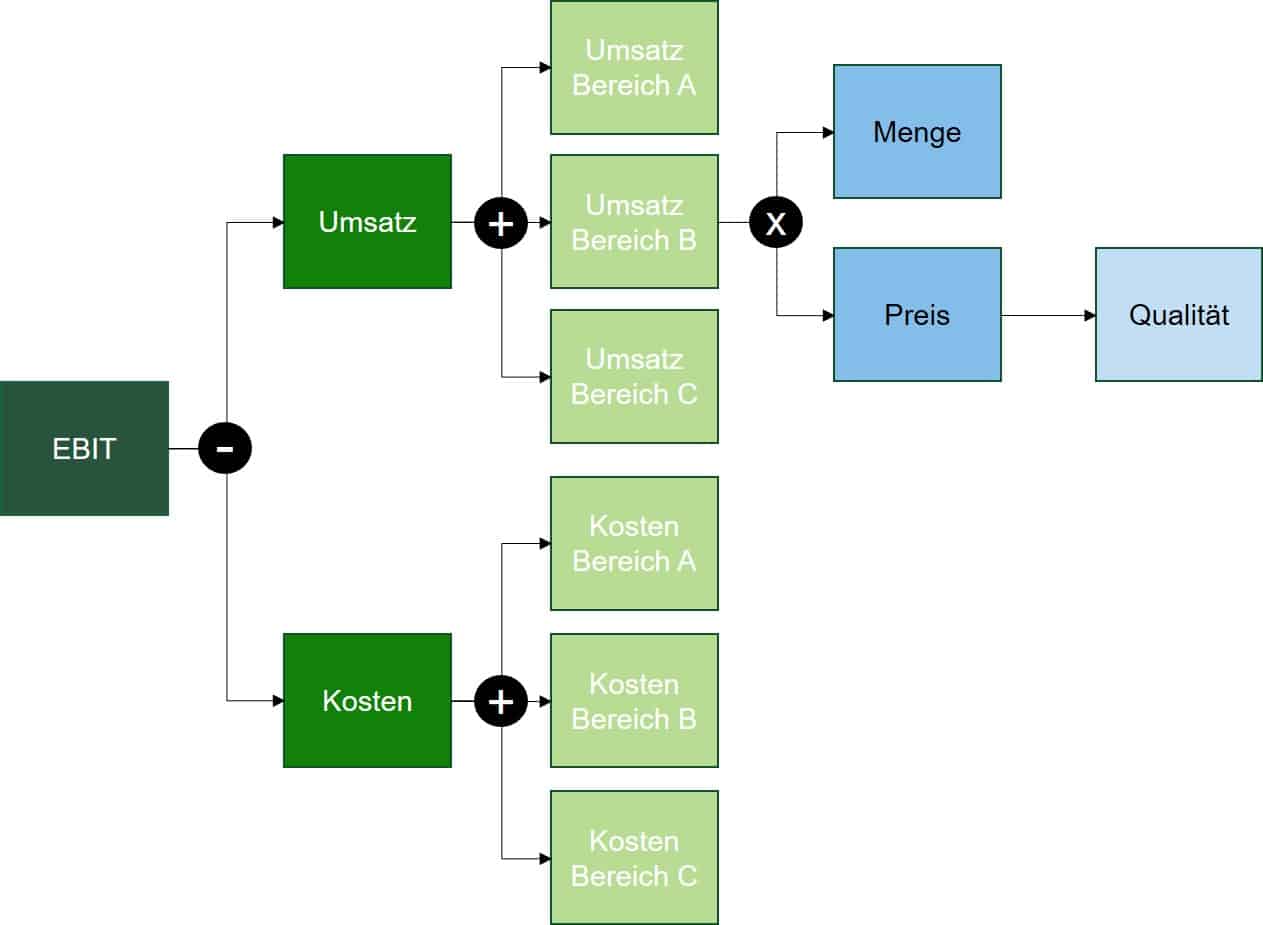
The value driver tree always starts with a major overarching corporate goal, e.g. a specific EBIT that is to be achieved. Based on this EBIT, mathematical and logical relationships are used to determine what leads to this target (for the example of EBIT: cost of sales). These relationships can be examined down to the smallest detail. Figure 3 shows an example of a value driver tree. A key figure can now be determined for each field in the value driver tree. The advantage of this method is that the individual levels of the value driver tree are mathematically and logically linked to each other, meaning that there is always a connection between the process KPIs.
The disadvantage is that KPI systems based on the value driver tree are often dominated by financial targets and KPIs, meaning that other areas are completely neglected. If you want to use the value driver tree, you should therefore make sure that you also integrate non-monetary key figures such as employee satisfaction into your KPI system. You can also attribute a monetary value to these seemingly non-monetary KPIs and link them in this way. For example, employee satisfaction has an impact on motivation and therefore ultimately on the company’s financial results.
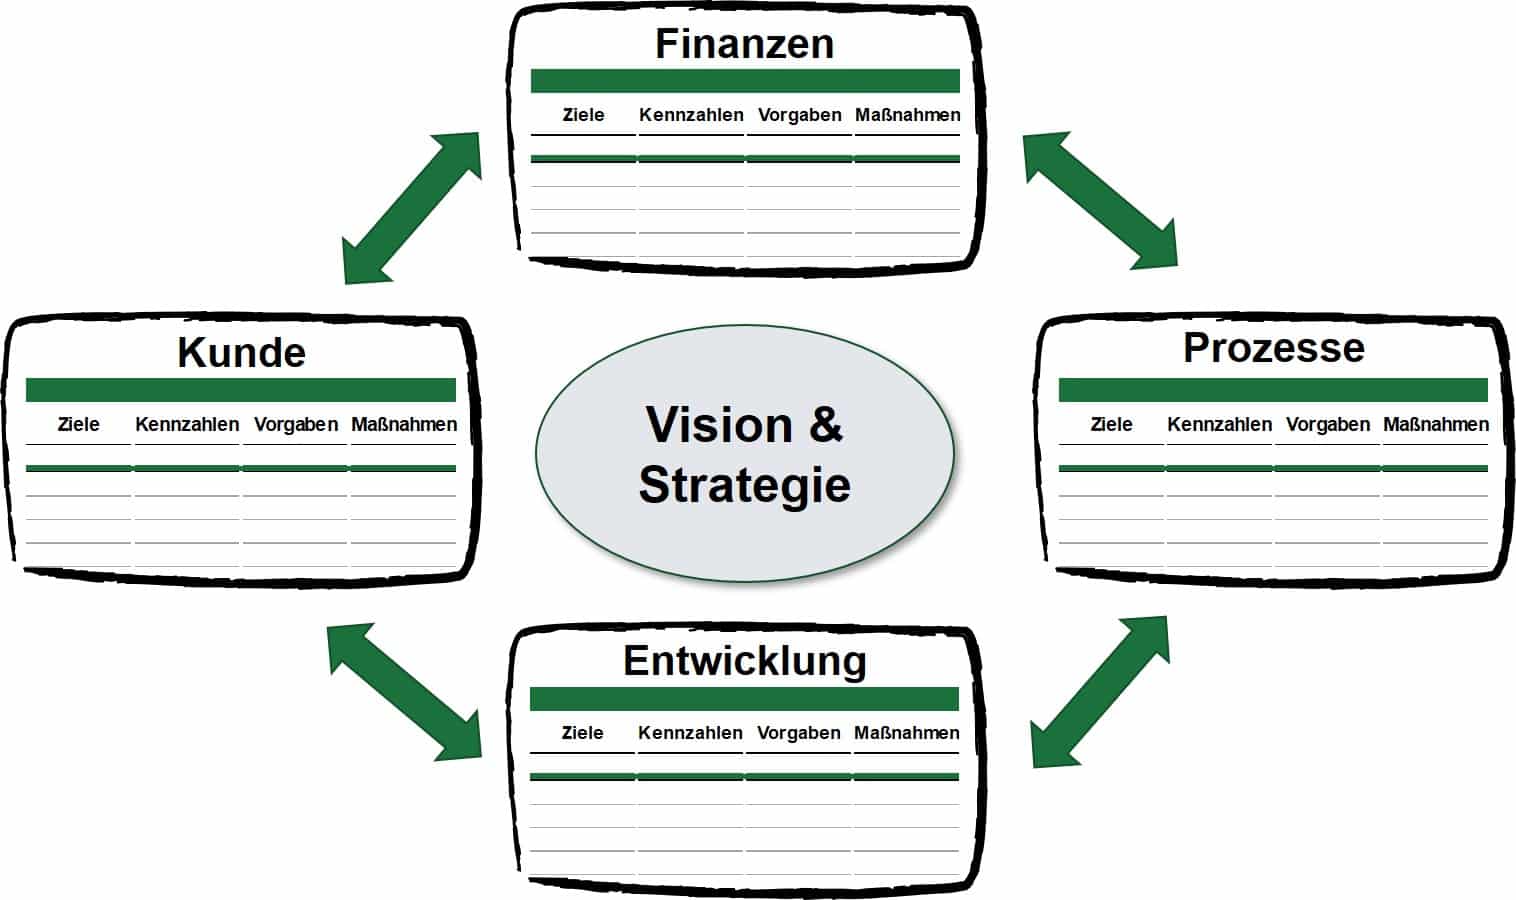
In addition to the value driver tree, the balanced score card (BSC) is a widely used key performance indicator system. In the BSC methodology, targets are defined for the four areas of finance, customer, process and development based on the corporate vision and strategy. Key figures must be determined for each target in order to measure target achievement. In addition, targets must be set and measures defined to achieve the objectives. A good guideline for the number of targets per area is four, which means you end up with 16 key figures that you regularly collect and derive measures from.
It is a good idea to create the BSC as a team, as this allows input to be gathered from everyone involved. You will always have several BSCs in your company that overlap. Within logistics, for example, there could be three different BSCs for procurement, warehouse and shipping. These three BCCs then result in the overarching logistics score card. In this way, you have also defined the targets and KPIs for each department at the same time.
The great advantage of the balanced score card is that you have key figures from different areas. Another advantage, if you stick to the rule of four targets per area, is the number of key figures. With 16 key figures, you have exactly the right number to control and monitor a department or division. The disadvantage of this method is the resource-intensive creation of the BSC. In addition, the BSC does not necessarily ensure that the key figures are linked to the overall company objective. With the value driver tree, this is necessarily mathematically and logically given.
In the previous steps, we have shown you how to identify the right KPIs and set up a KPI system. The only thing missing now is the final step: establishing a key performance indicator management system. First of all, you should think about how to record and visualize your key figures. There are a large number of BI tools on the market today that can process a large amount of data and visualize it in an appealing way. It is important to focus on a tool that is used by all departments in your company. Otherwise you will have additional expenses for licenses, training, implementation, maintenance, etc.
You also need to determine the frequency with which key figures are collected and what the reporting structure looks like. Reporting for the management or the board of directors may take place once a quarter with a few KPIs, while a warehouse manager wants to know how the warehouse KPIs are developing on a daily basis. When reporting to people who do not work in the area in which the KPIs are collected on a daily basis, it is important to comment on the figures. Some KPIs will be reported temporarily to track a specific measure, others permanently.
Establish a reporting structure and key performance indicator meetings to derive measures.
Dominik Fackler, Senior Consultant
You should also set regular meetings in which you discuss CIP measures based on suitable process KPIs, for example, and derive measures. In addition to the right structure, a functioning KPI management system requires clear responsibilities. It must be defined who is responsible for collecting and reporting the KPIs. It is important to note that the person who sets targets and defines key figures should not be the same person who collects and reports them. Otherwise, there is a risk that key figures will be manipulated in order to ensure that personal targets are achieved.

Before you introduce KPI management, you should think about why and how. What is the purpose of your KPIs and which KPI system do you want to work with? This is the only way to end up with a meaningful KPI management system that will really get you ahead. In our projects, we often notice that companies collect a lot of unrelated key figures that are meaningless. Concentrate on a few balanced key figures for your production and logistics!

Manager, Munich
As a manager, Dominik leads various projects, particularly in the areas of factory planning, business process optimization in production and supply chain as well as digital operations.


Recirculating systems are compact, automated storage systems for fast access, high efficiency and optimum use…
The lack of space is forcing factory planners to rethink. New innovative concepts must therefore…
Strategically shaping sustainable production: Find out how companies are using site planning, circular economy, energy-efficient…
You need to load content from reCAPTCHA to submit the form. Please note that doing so will share data with third-party providers.
More InformationYou are currently viewing a placeholder content from Turnstile. To access the actual content, click the button below. Please note that doing so will share data with third-party providers.
More InformationYou are currently viewing a placeholder content from Facebook. To access the actual content, click the button below. Please note that doing so will share data with third-party providers.
More InformationYou are currently viewing a placeholder content from Instagram. To access the actual content, click the button below. Please note that doing so will share data with third-party providers.
More Information